Preloader Close
  • Ground floor, The South Bay Building, Rodney Bay, Gross-Islet Saint Lucia, P.O. box 838, Castries, Saint Lucia.

Technical Analysis

Market action discounts everything

This means that actual price is the reflection of everything that is known to the market that could affect it.

Some of these factors are inflation , interest rate etc supply and demand, political factors and market sentiments. However the pure technical analysis is only concerned with price movement, not with the reasons for any changes.

Price move in trends

Technical analysis is used to identify the patterns of market behavior that has long been recognized as significant.

For any given pattern there is a high probability that they will produce the expected results.

There are also recognized patterns that repeat themselves on a consistent basis.

History repeat itself

Forex chart patterns has been recognized and categorized over 100 years and the manner in which many patterns are repeated leads to the conclusion that human psychology changes little over time.

Since patterns have worked well in the past, it is assumed that those patterns would work well in the future.

There are Three Types of Trend

  • UP TREND
  • DOWN TREND
  • SIDEWAYS TREND

Technical Analysis Categories/Approaches

1. Price Indications (oscillators e.g. RSI)

2. Number theory (Fibonacci numbers, Gann Numbers)

3. Waves (Elliott's wave theory)

4. Gaps (High –low, open – close)

We will look into trend lines and how they can be used to maximize the information available to you through your superior charting tools on AchieverFX's MT5 platform. You can learn more about technical analysis by attending one of our FREE weekly webinars.

Trading products

Choose Assets - Unlimited Opportunities

Line Chart

The simplest form based upon the closing trades forming a homogeneous line. This chart does not show what happened during the time unit selected by the viewer, only closing rates for such time intervals. The line chart is a simple tool for setting up for support and resistance levels.

Point and Figure Graph

Chart based on price without time. Unlike most other investment charts, points and figure charts do not present a linear representation of time; instead, they show trends in price.

Bar Chart

This chart shows three rates for each time unit selected: the high the low and the closing. This chart provides clearly visible information about trading price range during the trading period; so are popular with many short term traders. Below are examples of a EURUSD bar chart; and a breakdown of one bar below to show what information it contains clearly.

Candle Stick

This type of chart represents prices at their opening, high, low and closing prices. Like a bar chart this type of chart contains several key pieces of information and in this case it is represented not as a bar but in the form of candles, for each time frame unit selected. The empty (transparent) candles show an increase, while the dark one shows a decrease. The length of the candle shows the range between opening and closing, while the whole candle shows the whole range of trading prices for the selected unit item.

Trend Lines

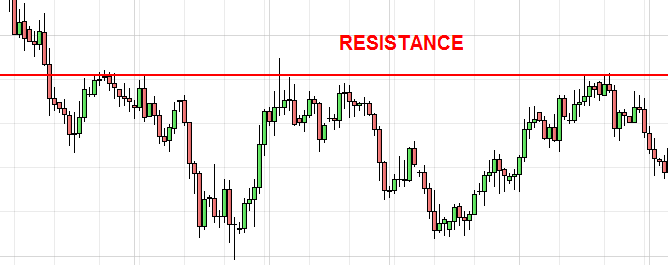
Trend Line: a sloping line of support and resistance

Uptrend Line: straight line drawn upward to the right along successive reactions low.

Down Trend Line: straight line drawn downwards to the right along daily successive picks.

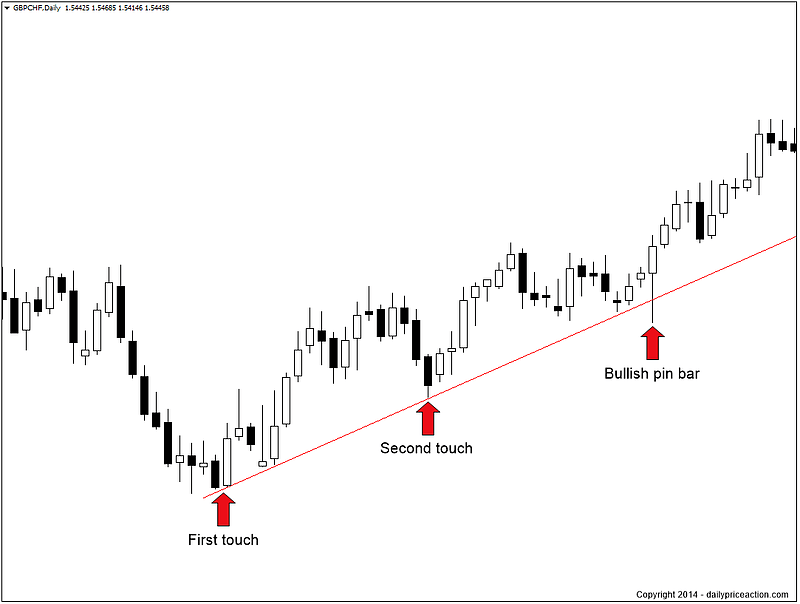
Two points are needed to draw the trend line, and the third point to make it valid trend line. Trend line is used in many ways by traders. One way is that when price returns to an existing principle trend line' it may be opportunity to open new position in the direction of the trend in the belief that the trend line will hold and the trend will continue further. A second way is when price action breaks the principle trend line of the existing trend, it is evidence that the trend may be going to fall and the trader may consider in the opposite direction of the existing trend, or existing position in the direction of the trend.

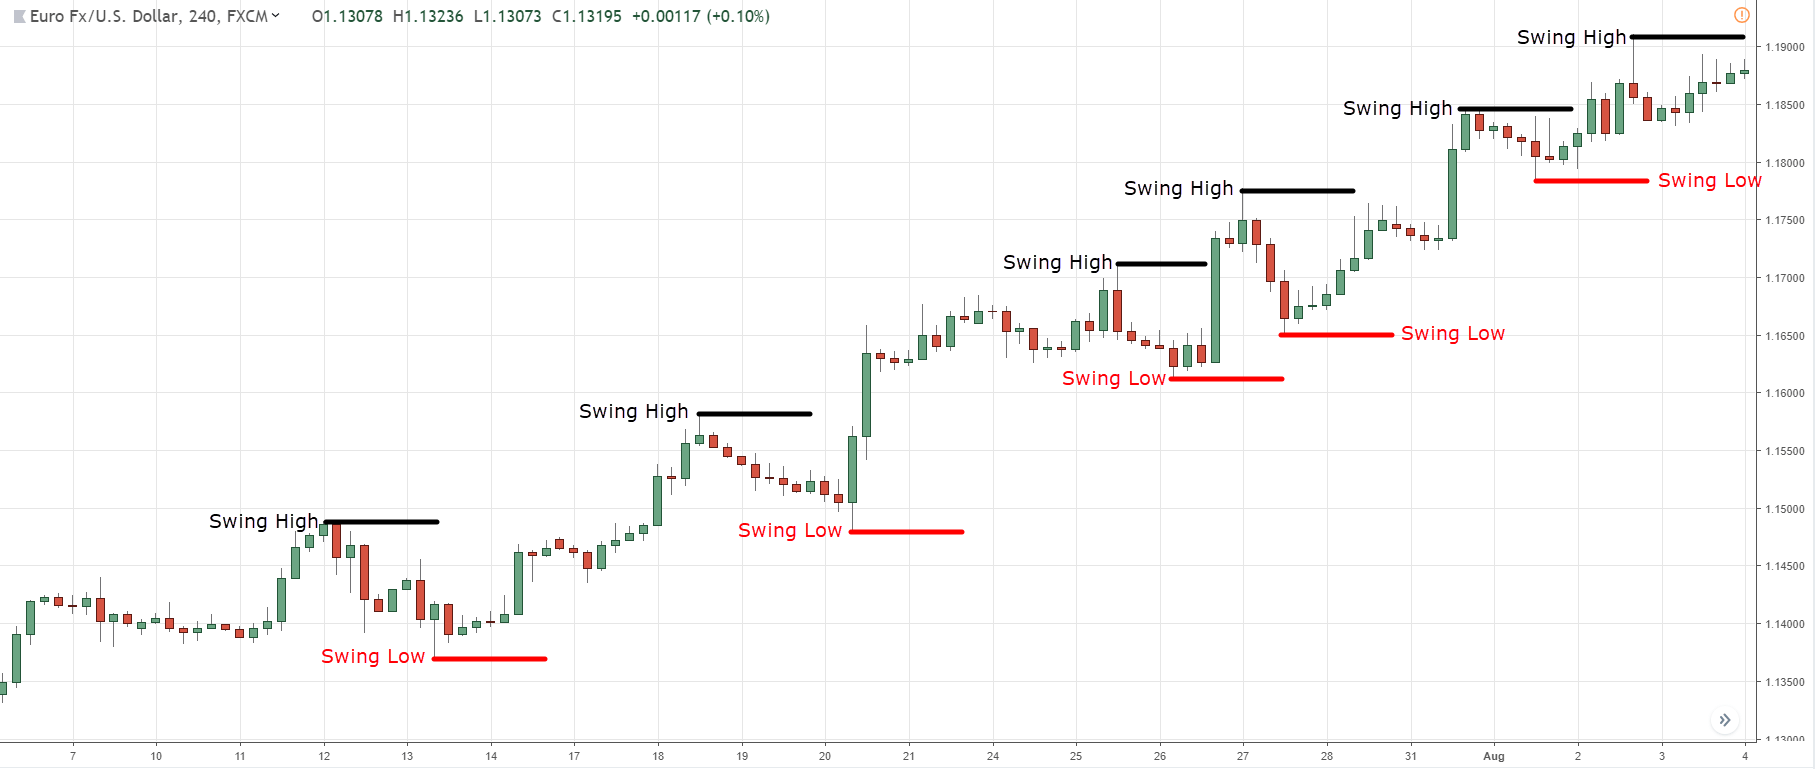
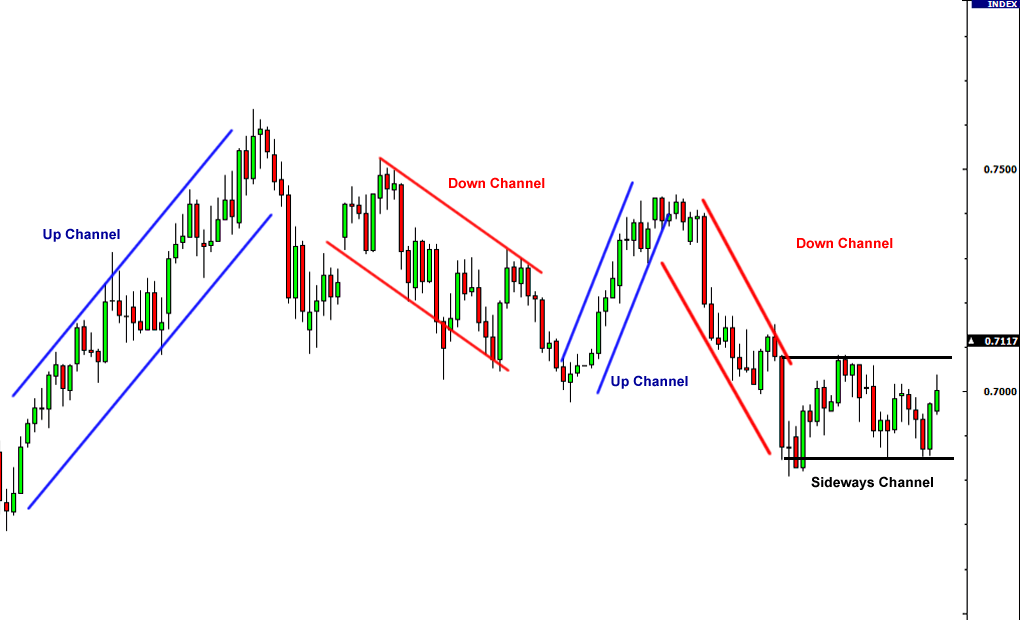
Remember the Trend is simply the overall direction of price movement; up, down or Flat. Below is an illustration of a trend line, comprising of a short and intermediate trend and then the overall long term trend as well; so you can see how trend lines can be broken down further.

Trend Analysis & Timing

Markets don't move straight up and down. The direction of any market at any time is either Bullish (Up), Bearish (Down) or Neutral (Sideways). Within those trends, markets have countertrend (backing & filling) movements. In a general sense "Markets move in waves", and in order to make money, a trader must catch the wave at the right time.

Drawing Trendlines

The basic trend line is one of the simplest technical tools employed by the trader, and is also one of the most valuable in any type of technical trading. For an uptrend line to be drawn there must be at least two low points in the graph where the 2nd low point is higher than the first. A price low is the lowest price reached during a counter trend move.

Drawing Trend Lines – Below are some examples of annotated charts with trend lines drawn to help guide you:

Channels

When price trend between two parallel trend lines they form a channel. When prices hit the bottom trend line this may representative of a buying area and when prices hit the upper trend line this may be representative of selling.

Support

Price supports are price areas where traders find that it is difficult for market prices to penetrate lower. This will happen for example if buying interest in the dollar is strong enough to overcome selling interest in the dollar keeping prices at a sustained level. In the chart below you can see the support level in RED. Clearly the price has fallen to this level at least 3 times and failed to go below; hence this is a support level. Eventually this support level gives way but not after holding for a while; giving trader’s valuable information and time to take a view and place their trades.

Resistance

Resistance is the opposite of support and represents a price level where selling interest overcomes Buying interest and advancing prices are turning back. In the example below, a resistance line has been drawn as well as the support line below this. Many times these lines will appear in pairs. This will create a tradable range for a short period of time. During this time the price will move in between the resistance and resistance support levels; until one of these levels is overcome. Then the new trend, along with support and resistance must be determined.

Retracements -50% Retracements

Retracement is when a prices resume their original trend for a short time (hence the name) before returning to the current trend. Retracements can be confusing sometimes and mistaken for a new trend but can represent a very short term opportunity for very short term traders such as scalpers or snipers. here is a graphical representation of a 50% retracement with annotations to help illustrate this:

Top Forex Indicators

Indicators are considered essential when trading in the forex market. Several forex traders use these indicators daily, which helps them understand when they can buy or sell in the forex market. These indicators are known as an important part of technical analysis, and every technical or fundamental analyst should be aware of these indicators. Here are the top 10 forex indicators that every trader should know:

Moving average (MA) is a crucial forex indicator that indicates the average price value over a particular period that has been chosen.
If the price trades are above the moving average, it means buyers are controlling the price, and If the price trades are below the moving average, it means sellers are controlling the price.
Therefore in trading strategy, a trader should focus on buy trades if the price is above the moving average. The moving average is one of the best forex indicators that every trader should know.

When it comes to measuring the price volatility of a particular security, the Bollinger bands indicator is used to determine the entry and exit points for a trade.
Bollinger bands come in three parts, the upper, middle, and lower brands. These bands are often used to determine overbought and oversold conditions.
The best part about this indicator is that it helps characterize the price and volatility over time of a financial instrument.

The Average True Range indicator is used to measure the market volatility. The key element in this indictor is the range, and the distinction between periodic low and high is called range.
The range can be applied on any trading period, such as intraday or multi-day. In the Average True Range, there is a use of the true range.
True range is the biggest of three measures:
1) Current high to low period
2) Previous close to current high period
3) Prior close to current low period
The absolute value of the biggest of the three ranges is called the true range. However, the average true range (ATR) is the moving average of specific true range values.

This is one of those indicators that tell the force that is driving in the forex market. In addition, this indicator helps identify when the market will stop in a particular direction and will go for a correction.
MACD is arrived at by deducting the exponential moving average of the long-term from the short-term EMA.
EMA is a kind of moving average where the current data gets larger importance. However, the formula of MACD is MACD = 12 Period EMA - 26 Period EMA.

Fibonacci is another excellent forex indicator that indicates the exact direction of the market, and it is the golden ratio called 1.618.
Several forex traders use this tool to identify areas and reversals where profit can be taken easily. Fibonacci levels are computed once the market has made a big move up or down and looks like it has flattened out at some specific price level.
The retracement levels of Fibonacci are plotted to find areas to which markets may retrace before moving back to the trend that the movement in the first price has created.

The RSI is another forex indicator that belongs to the oscillator category. It is known to be the most commonly used forex indicator and showcases an oversold or overbought condition in the market that is temporary.
The RSI value of more than 70 shows an overbought market, while a value lower than 30 shows an oversold market. Thus, several traders use 80 RSI value as the reading for overbought conditions and 20 RSI value for the oversold market.

This forex indicator showcases the demand-supply balance levels of a pair of currencies. If the price reaches the pivot point level, the demand and supply of that particular paid are at an equal level.
If the price crosses the pivot point level, it shows higher demand for a currency pair, and if the price falls below the pivot point level, it shows a higher supply for a currency pair.

Stochastic is considered one of the top forex indicators that help traders identify momentum and overbought/oversold zones.
In forex trading, the stochastic oscillator helps recognize any trends that are likely to be a reversal. A stochastic indicator can measure the momentum by comparing the closing price and the trading range over a certain period.

This indicator helps several forex traders understand the market's volatility by determining the higher and lower price action values.
Donchian channels are usually made of three different lines that have been formed by calculations pertaining to moving averages.
There are upper-lower bands around the median one. The area that lies between the upper and the lower band is the Donchian channel.

The parabolic stop and reverse (PSAR) is a forex indicator used by forex traders to arrive at the direction of a trend, assess short term reversal points of a price.
This indicator is mainly used to find spot entry and exit positions. The PSAR appears as a set of dots on a chart below or above the price of an asset.
If the dot is below the price, it indicates that the price is moving up. Conversely, if the dot is over the price, it indicates that the price is moving down.

Start Trading With Achiever Global Markets LTD