FOMC Policy Update & Market Analysis — March 2026
The Federal Open Market Committee (FOMC) concluded its two-day March meeting on Wednesday, March 18, 2026, by unanimously maintaining the target range for the federal funds rate at 3.50%–3.75% — the second consecutive hold following the 75 basis-point easing cycle that concluded in December 2025. One dissenter (Governor Stephen I. Miran) favoured an immediate 25bp cut, but the majority signalled patience.
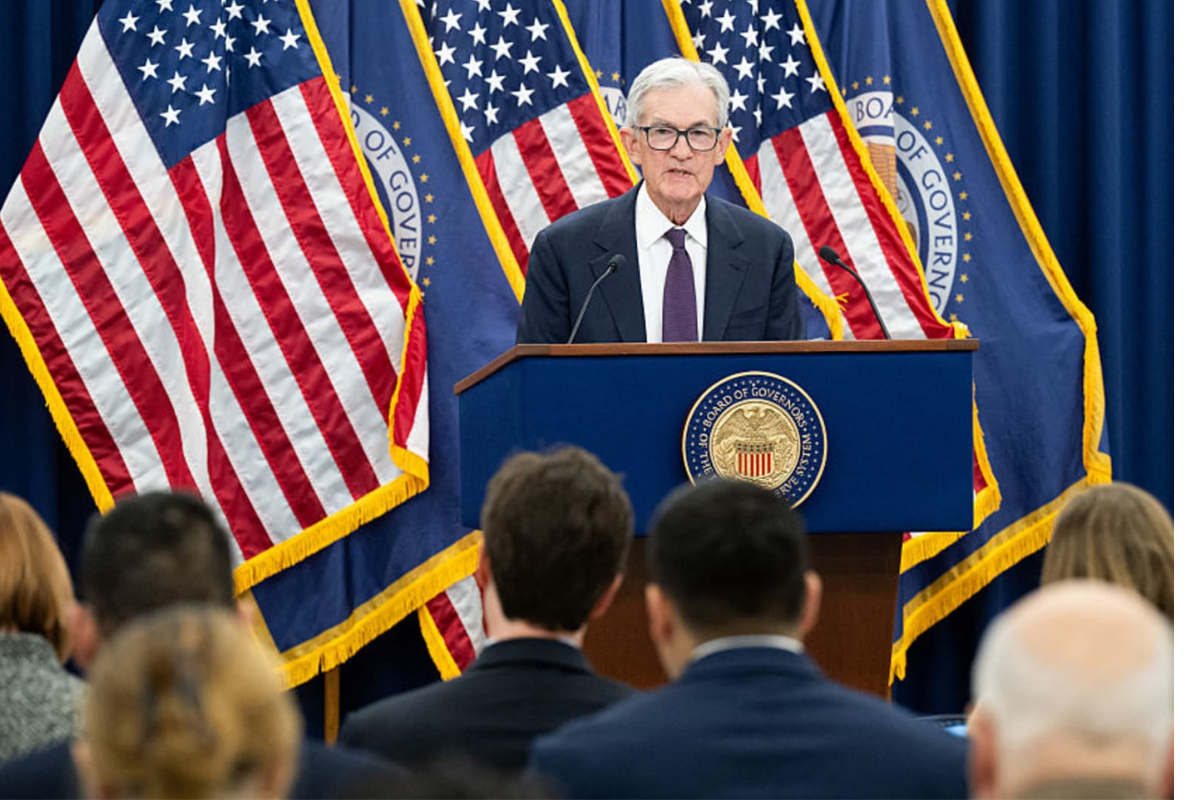
The accompanying Summary of Economic Projections (SEP) showed modestly stronger growth forecasts but higher near-term inflation readings, with the median policy-rate path unchanged at 3.4% by end-2026 (implying roughly one 25bp cut later this year). Chair Jerome Powell stressed elevated uncertainty stemming from Middle-East supply disruptions and recent tariff effects, describing the current stance as "appropriate" while keeping all options open.
📌 Market Reaction: Major U.S. equity indices closed 1.4–1.6% lower, oil prices extended gains, and the dollar strengthened on safe-haven flows. Precious metals came under notable pressure from the stronger USD and rising real yields.
Key Policy Decision
- Federal Funds Rate: Unchanged at 3.50%–3.75%
- Vote: 11–1 (Miran dissented in favour of a ¼-point cut)
- Forward Guidance: The Committee will "carefully assess incoming data, the evolving outlook, and the balance of risks" and stands ready to adjust policy "as appropriate" if risks to the dual mandate materialise.
The statement language was little changed from January, but added explicit reference to "developments in the Middle East" and noted that "uncertainty about the economic outlook remains elevated."
Economic Assessment
Available indicators point to solid economic expansion: resilient consumer spending, expanding business fixed investment, and a still-weak housing sector. The labour market remains balanced with unemployment steady at 4.4%. Inflation is "somewhat elevated" at 2.8% headline and 3.0% core PCE, lifted by tariffs and energy prices.
Summary of Economic Projections (SEP) & Dot-Plot
| Indicator | March 2026 Projection | vs. December |
|---|---|---|
| Real GDP Growth | 2.4% | ↑ Higher |
| Unemployment Rate | 4.4% end-2026 | Unchanged |
| Total PCE Inflation | 2.7% | ↑ Higher |
| Core PCE Inflation | 3.0% | ↑ Higher |
| Fed Funds Rate (end-2026) | 3.4% median | Unchanged path |
The dot plot continues to embed approximately one 25bp cut in 2026, with the distribution shifting slightly hawkish. Powell gave no timetable for cuts, reinforcing a data-dependent, meeting-by-meeting approach.
Chair Powell's Press Conference — Key Takeaways
- Solid growth with geopolitical uncertainty from Middle-East oil disruptions
- Visible tariff effects on goods prices already feeding through
- Policy stance now "within a range of plausible estimates of neutral"
- No timetable for cuts — fully data-dependent and meeting-by-meeting
- Remains committed to returning inflation sustainably to the 2% target
Market Reaction
📈 Equities
Dow Jones fell 1.6%, S&P 500 declined 1.4%, and Nasdaq dropped 1.5% at close. The risk-off reaction reflected the lack of dovish signals and the hawkish tilt in the dot plot distribution.
💉 Currencies
The U.S. Dollar Index (DXY) rose approximately 0.5% to close near 100.09–100.17, reflecting renewed strength on reduced rate-cut expectations and safe-haven flows. EUR/USD and GBP/USD weakened modestly (0.4–0.6%), while USD/JPY climbed. Emerging-market currencies faced broad pressure.
🥇 Gold & Silver
Spot gold declined sharply, closing around $4,820–$4,885 per ounce (down roughly 2–3% on the day). While Middle-East risks initially provided some support, the stronger USD, rising real yields, and hawkish Fed tone dominated — pushing prices lower after recent record highs above $5,000–$5,400 earlier in 2026.
Silver underperformed gold, falling around 3–6% to settle near $71–$77 per ounce. The higher-beta industrial component amplified the move amid cautious growth signals and profit-taking; the gold/silver ratio widened notably.
💋 Oil & Bonds
Oil extended its rally on Middle-East supply concerns. 10-year Treasury yields edged higher by 4bps, reflecting the slightly hawkish outcome.
📈 Investment Implications — Achiever Global Markets View
- Fixed Income: Front-end preference; cautious on duration given upward yield pressure.
- Equities: Defensive sectors and quality dividend payers favoured; energy names may benefit from oil strength.
- Precious Metals: Gold retains long-term hedging value but faces near-term headwinds from USD strength. Tactical longs may be trimmed or re-entered on dips toward major support. Silver suitable only for aggressive portfolios with strict risk management.
- Currencies: USD strength expected to persist. Favour selective long-USD positions vs. EUR/GBP; use EM currency hedges where appropriate.
- Portfolio Positioning: Neutral-to-cautious equity exposure. Increase cash/short-duration buffers. Monitor upcoming CPI, employment data, and geopolitical developments.
Outlook for the Rest of 2026
With only one cut now priced for 2026 and inflation risks tilted upward, the "higher-for-longer" regime is likely to extend. The June SEP update will be pivotal. At Achiever Global Markets we continue to stress-test portfolios against 0–2 cuts this year and stand ready to adjust allocations accordingly.
Disclaimer: This analysis is for informational purposes only and does not constitute investment advice. Past performance is not indicative of future results.